Showing posts with label price. Show all posts

Friday, June 3, 2011

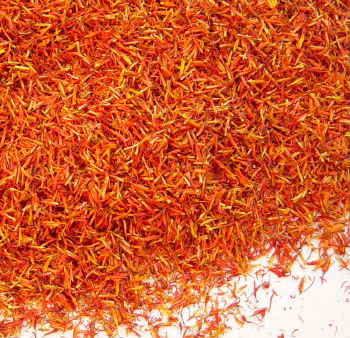
Safflower, safflower oil, Carthamus tinctorius

Safflower is an annual herb, native of Mediterranean countries and  known to humans at least  for 4000 years.
Originally it was grown mainly for it's flowers, a source of yellow and red (carthamin) dyes, though Ancient Chinese were using it's oil for a variety of things, like candle making, etc.
Because safflower has a similar color with saffron, it was  often used  to make fake saffron,  thus one of the safflower's nicknames is "Bastard's saffron". Other nicks are "Mexican saffron", "dyer's saffron" and "False saffron".
Now safflower is mostly grown for it's oil, though  there is still a demand  for it's flowers in many regions.
The oil in safflower contains almost 75%  linoleic acid, which is  higher than soybean, corn, cottonseed, peanut or olive oils. This type of safflower is used primarily for edible oil products such as salad oils and soft margarines. Scientists  disagree on whether oils high in polyunsaturated acids, like linoleic acid, can decrease blood cholesterol and the related heart and circulatory problems. Still, it is considered a "high quality" edible oil and public concern about this topic made safflower an important crop for vegetable oil.
Varieties that are high in oleic acid may serve as a heat-stable, but expensive cooking oil used to fry potato chips and french fries. As an industrial oil, it is considered a drying or semi drying oil that is used in manufacturing paints and other surface coatings. The oil is light in color and will not yellow with aging, hence it is used in white and light-colored paints. This oil may also be used as a diesel fuel substitute, but as other vegetable oils, is currently too cost-prohibitive for this use.
The meal that remains after oil extraction is used as a protein supplement for livestock. The meal usually contains  24% protein and a lot of  fiber. Decorticated meal (most of hulls removed) has about 40% protein with a reduced fiber content. Foots are used to manufacture soap. The birdseed industry buys a small portion of the seed production. Sheep and cattle can graze on safflower and stubble fields after the  harvest.
Production
In 2009,  646 427 tonnes of safflower seeds were produced by 23 countries. Over the last 50 years, world production of safflower seeds grew by about 100%.  Highest ever  crop of safflowers was in 1979, when 1 110 535 tons were produced. Lowest crop since 1961 was in 1961, when 326 997 tons were produced.
Land usage decreased by 1% since 1961. In 2009, crop of safflower used  752 455 hectares of land , which is about 0,048% of all arable land in the world.
Biggest producer in the world is India with 189 000 tons as of 2009.
Biggest producer per capita is Kazakhstan  with  4.36 kg of safflower seeds produced as of 2009.
As much as 95 grams of safflower seeds were produced per potential consumer of 2009. That is almost 500 calories.
World safflower seed crop could supply as much as  4.6 million people with 2000 calories a day,  and there is enough of protein for 5.7 million people.
Best  average worldwide yields were 961.8 kg per hectare in 1998, worst, since 1961-- 431.8  kg/ha ( 1961). Individual record belongs to USA  2447.2 kg per hectare in 1971.
Almost 19 000 tonnes were used as seed in 2009.
Average price for safflower seed is $550-700 per ton as of today.
Production of safflower seed by country:

item200720082009
Argentina
Safflower seed
58000 33480 86991
Australia
Safflower seed
2040 2104
6242
Canada
Safflower seed
2592
3366
3259Im
China
Safflower seed
32000 32500F 34000F
Ethiopia
Safflower seed
11176 8075 5552*
Hungary
Safflower seed
83 237 59
India
Safflower seed
240000 225000 189000
Iran (Islamic Republic of)
Safflower seed
658
593
599Im
Israel
Safflower seed
0F 0F 0F
Kazakhstan
Safflower seed
43940 45740 67000*
Kyrgyzstan
Safflower seed
12039 12830 14636
Mexico
Safflower seed
113334 96413 95000F
Morocco
Safflower seed


M
M
Occupied Palestinian Territory
Safflower seed
5 3 3F
Pakistan
Safflower seed
49 60 65
Portugal
Safflower seed

M
M
M
Russian Federation
Safflower seed
40 580 350
Spain
Safflower seed
24 30F 35F
Tajikistan
Safflower seed
1036 562 600F
Turkey
Safflower seed
2280 7068 20076
United Republic of Tanzania
Safflower seed
8846I9921Im10071Im
United States of America
Safflower seed
95547 140810 109756
Uzbekistan
Safflower seed
3500F 3621Im3133Im
World + (Total)
Safflower seed
627189A 622993A 646427A
My usual sources are fao.org,usda.gov, cia.gov, alibaba.com. Thank you for your visit!   

Here is the list of all articles at  Ironrye:

 http://ironrye.blogspot.com/2011/10/list-of-all-articles-at-iron-rye.html

Thursday, February 24, 2011

Platinum, Platina , Platine, PT

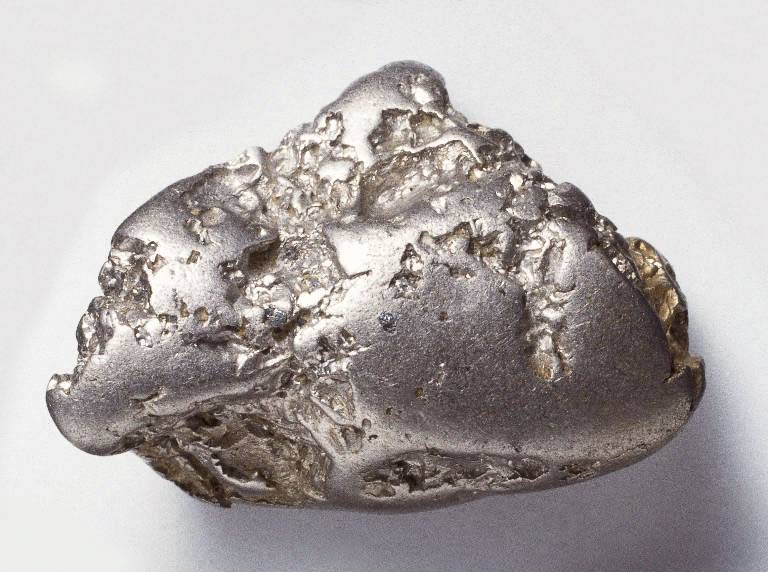
Platinum nuggets were first discovered in pre-Colombian times, later by Spanish gold diggers in Columbia,(first written account dated 1557) who were really annoyed by its presence. The metal had no use--its high density was used though to fake gold coins.Today these fakes cost by far more than originals.
As an element it was discovered in S. America by Ulloa in 1735. In Russia , platinum was discovered in 1821 in gold mines of Ural mountains.In 1824, purely platinum ores were discovered in the mountain named "Blagodat'" which means "Bonanza" or "god-given gift" in Russian. Conveniently for Russia, Columbia cut off exports of platinum in 1820. Still, not knowing what to do with this sudden but useless at the time bonanza,(by 1828, Russia was digging up to 1550 kg of platinum per year, which is over 150% of all platinum mining in South America (read "world") from 1741 till 1825 combined), Russian Tsar started to mint platinum coins for circulation, planning to hold on to some gold for
themselves.
Coins were minted in exact sizes of 25, 50 kopeck coins and 1 rouble and their denominations were 3
(1 371 691 pieces, about 10 grams each), 6 ( 14 847 p ) and 12 roubles (3474 p). Because of a similar size and color with silver coins, and novelty of platinum, it didn't go well with the public though. In 1843, 3500 kg of platinum were produced in Russia versus 20-40 kg in the rest of the world ( read Columbia), and prices started to fall. As a result Russian finance minister Vronchenko ( Ukrainian as a minister in Russia of 1840s? must have been a rare breed) had an attack of paranoia and decided that evil westerners will be forging roubles with cheap platinum bought directly from Russia, and ordered all platinum coin to be taken out of circulation within 6 months, in 1845. Not one fake coin was found.
This drastic and panic measure caused Platinum price to drop so low, that Platinum production went down
almost 100 times by the end of 1840s.

In 1867, Alexander II canceled state monopoly over platinum and allowed tax-free export, so British company-- guess who-- Johnson Matthey & Co, currently largest platinum distributor in the world, bought all of it --all 16+ tonnes (mostly in coin) from Tzar's hands.

As a result, British company became a long-term monopolist in platinum business without producing 1gram of it. Russia was producing 90-95% of world's platinum up until WW1. Price gradually was going up, and in 1920 it was 8 times more expensive than gold. In 1920s, South African mines came into the play. The production of platinum grew continuously, and for many years now South Africa is producing 70-80% of all worlds platinum, generating $7-8 billion by production.

For many decades ores were rich and mining was easy, now it gets quite a bit tougher, especially considering new labor laws in South Africa.

At least 5 major Canadian companies are digging for platinum in SA, and one of them , a Vancouver-based
Platinum Group Metals Ltd ( PTM-T) is building a $443 million mine in Bushveld as we scratching our tongues here. On the other hand , continuous marginalization and zimbabwication of South Africa, continuous talks about nationalization of mines and continuous pressure on mining companies to provide services to towns around their mines that have over 40% unemployment and 6 kids per each woman will not end well in any case.

The Bushveld Complex in South Africa is the main producer area, with the company AMPLATS as the industry leader. The other significant area is the Norilsk region in Russia. Russia is also the only country with significant stockpiles of platinum(it ceased to sell any Pt from state reserves in 2000), although it is believed that their level has decreased. Russian Government export policies have influenced platinum supply volatility.

Production of platinum, kg:           2008         2009
South Africa    , platinum           146 000     140 000
Russia               platinum             23 000      19 747
Canada             platinum               7 000        5 000
Zimbabwe         platinum               5 640       6 000
USA                 platinum               3 580       3 800
Columbia          platinum               1 300          929.182
Other:               platinum               2 140       2 000

Colombia 2010-January -June 413.172 kg of platinum

So the grand total for 2009 was 177 tonnes of platinum. With density at 21.45 g per cubic sm its a small cube with the height of a tall human.

That's about 26 milligram per every human on the planet( as of 2009; production of platinum for 2010 and 2011 was supposed to grow a bit). A small $10 US platinum coin or 1/10th of an ounce coins of Canada, China , Australia contain a hypothetical "share" of 120 people.
South Africa produced a hopping 2.8 grams of platinum per each citizen in 2009.

10-20 tonnes of ore must be processed to get 1 ounce of metal, and it takes 5-6 months.


Platinum is used as a catalyst for countless chemical reactions. The most important use of platinum is in vehicles, as a catalytic converter(especially in diesel engines), facilitating the complete combustion of unburned hydrocarbon passing through the exhaust.

Platinum is used in jewelry, decorative plating and dental work. The metal and its alloys are also used for electrical contacts, fine resistance wires and medical / laboratory instruments.

An alloy of platinum and cobalt is used to make strong permanent magnets.

The metal is also used to make electrodes sealed in glass (as its thermal coefficient of expansion is almost equal to that of glass) and in medicine.

Example of use: Of the 239 tonnes of platinum sold in 2006 (in some years up to 70 tonnes are produced through recycling), 130 tonnes were used for vehicle emissions control devices,49 tonnes for jewelry, 13.3 tonnes in electronics, and 11.2 tonnes in the chemical industry as a catalyst. The remaining 35.5 tonnes went to various other minor applications, such as electrodes,anticancer drugs, oxygen sensors, spark plugs and turbine engines.

Abundance earth's crust: 5 parts per billion by weight, 0.5 parts per billion by atoms
Abundance solar system: 9 part per billion by weight, 0.06 parts per billion by atoms

The Stillwater and East Boulder Mines in south Montana were the only primary platinum-group metals mines in the USA and were owned by one company. Small quantities of PGMs were also recovered as byproducts of copper refining in Texas and Utah.
Import Sources for USA (2005-08): Platinum: South Africa, 27%; Germany, 17%; United Kingdom, 12%; Canada, 5%; and other, 39%.

At today's prices, world production of platinum is about $10.2 billion worth.


List of all articles at Ironrye:
 http://ironrye.blogspot.com/2011/10/list-of-all-articles-at-iron-rye.html


Friday, February 11, 2011

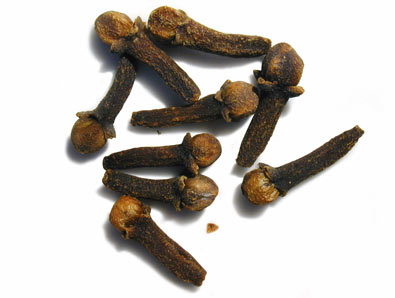
Cloves, Syzygium aromaticum , Eugenia aromaticum

Cloves are unopened  floral buds of a tropical tree Syzygium aromaticum, native of  Moluccas. Cloves had been an important commodity since at the very least 400 BC. Up to 18th century, you could find some places that would give you  1 kg of gold for 1 kg of cloves. Now, it costs about $2000-5000 per metric ton.
11 countries are producing cloves commercially, and the world crop of 2009 was  116 739 tonnes. That's about 17.1 grams of cloves per year per potential consumer.  That is about 200 individual cloves. Usually  it takes anywhere  from  9 to 15 million  individual  cloves  to come up with 1 metric ton.
 Biggest producer and consumer of cloves is Indonesia, which is producing over 70% of world's cloves. Smoking cloves is a  very popular habit in Indonesia. Biggest producer per capita is Comoros islands, (over 5 kg of cloves). Comoros dedicated over 5.8% of their territory to clove production  ( 25% of all permanent crop land).
Biggest concentration of the trees you will find on Pemba, a  big Tanzanian island . Almost 3 500 000 clove trees are grown there, on 984 sq km.  Somehow they find room for 385 000 local residents as well. A glass of bottled water will get  some clove under taste and smell within a few minutes on that island. A lot of Eugenol, the main aromatic clove oil, is in the air.              
Over 384 950 hectares ( note- Brazilian acreage wasn't included here) were used  for clove production in 2009, a territory similar in size to South Georgia and South Sandwich islands combined. That is over  0.248% of all permanent crop land in the world.
The calorie content of 2009's crop is big enough to provide 480 500 people with 2000 calories a day. Protein content would be big enough to provide 50g a day to 366 000 people.
Best crop ever of cloves was in 2003, (153 048 t), worst, since 1961-- 19 090 tonnes in 1962.
Best worldwide yields since 1961 were in 1967, 402 kg/ha. Worst were in 1989 ( 147.6 kg/ha). Record yield belongs to China 1166.6 kg/ha in 2004. China started to produce its first cloves in 1986.
Note as of  25/05/ 2011 -->  crop of cloves in Indonesia is expected to fall dramatically this year  to 25 000 tonnes vs the usual 85 000.Prices for cloves in Indonesia are reaching $5500 per ton and local consumers are starting to buy cloves from Brazil and other major exporters.
Update March 2012-- Brazil  and most others are sold out; prices  are around $15-20 000 per ton. Interesting times ahead.
World crop is over $ 400 million worth.

List of all articles at Ironrye:
 http://ironrye.blogspot.com/2011/10/list-of-all-articles-at-iron-rye.html

Production by country,            2007                     2008            2009
 Brazil                                    Cloves 5000         6000            6500         (2010--6000 t )
China
Cloves
800F 825F 900F
Comoros
Cloves
3500* 3500F
M
Grenada
Cloves
20F 20F
M
Indonesia
Cloves
80404 80929
M
Kenya
Cloves
1000F 1000F
M
Madagascar
Cloves
10000F 10000F
M
Malaysia
Cloves
200F 200F
M
Mexico
Cloves

M
M
M
Sri Lanka
Cloves
3070 3990 3790
United Republic of Tanzania
Cloves
9900F 9900F
M
World + (Total)
Cloves
113894A 116364A 116739


My main sources are FAO.org, USDA.gov, CIA.gov, alibaba.com and many others. . Thank you for your visit!


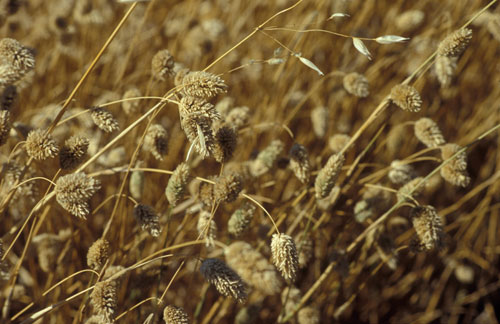
Canary seed , Alpiste, Phalaris canariensis

Canary seed grass is a native of a Mediterranean region. It is used mostly as a bird food, but  it can be used for  human consumption also. It might cause an esophageal cancer though, if you are not careful, unless you use spike less variety. Microscopic spikes of canary seeds annoy /kill esophageal cells, so their neighbors have to breed faster, and as a result the chance for cancerous mutation is bigger. Right now  canary seed is used as food by North Africa, Italy, parts of Spain and Mexico.
Only 12 countries are growing canary seed / alpiste commercially according to FAO.org, but  the number is more likely to be 10 as Morocco and Netherlands apparently are out of the picture of the canary seed business. Biggest producer both by volume and  per capita is Canada,  141 900 t  of canaryseed produced in 2009. That's about 4.13 kg of canary seed per Canadian. Worldwide,  196 150 tonnes were produced (2009), or 28.4 grams  per potential consumer.
World crop could  provide nutrition for  about 1 mln people.
 213 619 hectares were used for canary seed production in 2009 , a territory close to the size of Comoros islands.

List of all articles at Ironrye:
 http://ironrye.blogspot.com/2011/10/list-of-all-articles-at-iron-rye.html


Best crop ever was in 2004 (378 042 tonnes), worst since 1961-- 47 408 tonnes (1966)
Best global yields were 1212.9 kg/ha in 1990, worst since 1961-- 664.6 kg/ha in 1977.
Record yield belongs to Czech republic , 3500 kg/ha, on some small experimental field. Aside of that, top yield was 1742.8 kg/ha in Turkey (2006)
Canaryseed costs around $1000 per ton,  world crop is about $ 190-210 million worth.

Production by country,              2007            2008            2009
Argentina
Canary seed
9050
10023
9763
Australia
Canary seed
4000F 5000F
M
Canada
Canary seed
162000
195600
141900
Czech Republic
Canary seed
700
700

M
Hungary
Canary seed
5972
12343
5389
Mexico
Canary seed
183
227

M
Morocco
Canary seed
0F 0F
M
Netherlands
Canary seed

M
M
M
Spain
Canary seed
70F 70F
M
Thailand
Canary seed
30000F 30000Fc30000Fc
Turkey
Canary seed
62
17
61
Uruguay
Canary seed
2800F 3040F
M
World + (Total)
Canary seed
214837A 257020A 196150A

Thursday, February 3, 2011

Ginger, Jengibre, Zingiber officinale

root of ginger, Zingiber officinale
Ginger is a South Asia's native, where it was  grown for at least 3000 years. First known name of Ginger is singabera , which  means "root with horns" in Sanskrit. Traders were bringing this root to European markets for at least 2000 years.
Now, Ginger is grown  in 32 countries commercially. The biggest producer (and also consumer ) of ginger is India with 380 100 t harvested in 2009.  The biggest producer per capita is Nepal, in 2008 they produced 176 602 t, which is about 6.2 kg of Ginger per each Nepalese. Nepal uses about 0.5% of  all arable land  for ginger production.
Worldwide, there were  about  237.7 grams of ginger available to every human in 2009, which is quite a bit considering how little of it  you need to spice things up. In a properly dried  form, it would be about 40 grams.
1 618 627 tons of ginger were produced in 2009.

427 423 hectares were used  for ginger production in 2009, more than ever in human history. It would be  a  territory bigger than Cape Verde and  Aruba combined.


List of all articles at Ironrye:
 http://ironrye.blogspot.com/2011/10/list-of-all-articles-at-iron-rye.html


Jamaica was producing some  of the finest Ginger in the world not that long ago, but rhizome root disease put an end to it. In November of 2010  3-year , $12 million + project was launched to do something about it, out of which $5.8 million were provided by Jamaican government.
No meaningful  results were achieved so far.
Yields in ginger farming are really interesting. I do not know any other plant yields of which differ so much.
In Pakistan, for example , you get less than 500 kg of ginger per hectare. In Nigeria--710kg, and in USA-- 34000 kg per hectare. 3786.9 kg/ha was an average yield in 2009.
Best yield ever was 56174.3 kg/ha in USA (2000).   Best yield of ginger worldwide  was in 2008, 3810.3 kg/ha. Worst (since 1961) 1921.8 kg/ha in 1961.
Best crop  ever worldwide was in 2009 (see above), worst, since 1961-- 60 360 tonnes in 1961.
flower of ginger
Prices, retail in USA is about $4-5 per pound. By bulk, you can pay anywhere from $200 to $1800 a ton , depending on many factors. World crop is about  $1 billion worth, and  international exports are about $200-220 mln

Production by country,   2006             2007             2008               2009
<><><><><><>
<><><><><><>
Bangladesh
Ginger
570006332577046
M
Bhutan
Ginger
757198709870F
M
Cameroon
Ginger
1133611000 11000F 11000F
China
Ginger
319824 327373 328810F 331810F
Costa Rica
Ginger
422910449551105
Côte d'Ivoire
Ginger
504082008200F
M
Dominica
Ginger
120 120 120F
M
Dominican Republic
Ginger
1500 1700F 551
M
Ethiopia
Ginger
8000 9000 9000F
M
Fiji
Ginger
3209311124482787
Ghana
Ginger
70 70F 70F
M
Grenada
Ginger

M
M
M
M
Guyana
Ginger
520F 520 520F
M
India
Ginger
391200393400382600380100
Indonesia
Ginger
177138178502192341F
M
Jamaica
Ginger
259241298
M
Japan
Ginger
38100427004980052000F
Kenya
Ginger
150 150F 150F
M
Madagascar
Ginger
30 30F 30F
M
Malaysia
Ginger
9966101501034011200
Mauritius
Ginger
10161299709616
Mexico
Ginger

M
M
M
M
Nepal
Ginger
154197158905176602
M
Nigeria
Ginger
134000138000F 140000F
M
Pakistan
Ginger
315795
M
Philippines
Ginger
27261279462753827415
Puerto Rico
Ginger
90 90F 90F
M
Republic of Korea
Ginger
461557503560
M
Réunion
Ginger
9696* 96F
M
Saint Lucia
Ginger
799
M
Sri Lanka
Ginger
676082701005010780
Thailand
Ginger
125000 153284161505170125
Trinidad and Tobago
Ginger
95F 95F 95F
M
Uganda
Ginger
120 120F 120F
M
United Republic of Tanzania
Ginger
10 10F 10F
M
United States of America
Ginger
19501270816
M
World + (Total)
Ginger
1490510A 1555707A 1605444A 1618627A


My usual sources  are : FAO.org, usda.gov, cia.gov, alibaba.com, many others

Thank you for your visit.

Tuesday, January 25, 2011

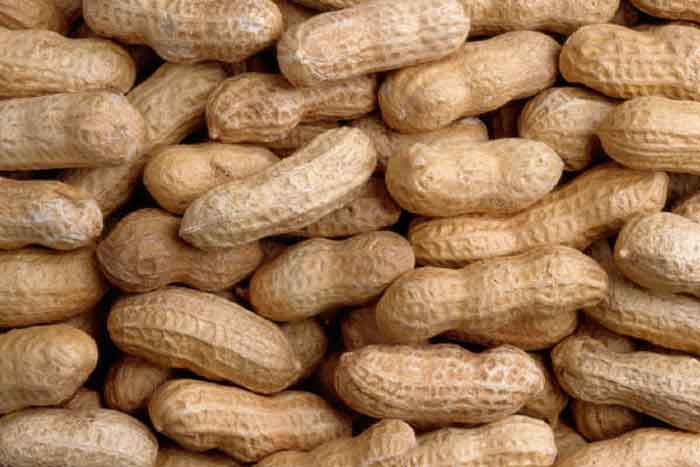
Peanut, groundnut (Arachis hypogaea)

A relative of a bean family, Peanut was domesticated around 5000 BC in Peru. Today, 115 countries are growing peanuts commercially. In 2009, world production was 35 520 257 tonnes, leaving an average Earthling with 5.2  kg of peanuts to munch on. Assuming 60% edibility, that is enough to last you over 9 days at 2000 calories a day.
World harvest of 2009 could feed 166.4 million people at 2000 calories a day, or  entire populations of Nigeria and Austria combined. World's peanuts have enough protein to supply 292 mln people with 50 grams a day.
23 507 014 hectares , or over 1.49% of all arable land in the world, were used for peanut production in 2009, a territory similar in size with Laos.
Biggest producer in the world is China, with 13 341 075 tons produced in 2009.
Biggest producer per Capita is Senegal with 80.2 kg produced in 2009.  Senegal and  many other countries of West Africa, where peanut consumption is substantial,  have a somewhat  significantly elevated rates of liver cancer, which many  link to a high peanut consumption, so be careful.
 Almost 44 % of all arable land of Senegal is used for peanut production. Peanuts constitute up to 60% of all agricultural exports from Senegal , 3/4 of which is in form of peanut oil.
Best yields worldwide since 1961 were in 2007 (1689.2 kg/ha), worst were in 1965 (881.8 kg/ha)
Record yield belongs to Cyprus, 12297.2kg/ha (1999).
Best crop  worldwide since 1961 was in 2008 (38 216 299 t), worst --14 134 052 t in 1961.


List of all articles at Ironrye:
 http://ironrye.blogspot.com/2011/10/list-of-all-articles-at-iron-rye.html


Peanut prices in USA:   January 19, 2011
      * $549.54 per ton for Runner peanuts
      * $541.68 per ton for Spanish peanuts
      * $553.06 per ton for Valencia peanuts
      * $553.06 per ton for Virginia peanuts


World crop is about  $15 billion worth .
Production, by country,                                          2007                  2008                2009                                                                                                                               
Algeria
Groundnuts, with shell
331932223057
Angola
Groundnuts, with shell
6666091925110828
Argentina
Groundnuts, with shell
600035625349605491
Australia
Groundnuts, with shell
1758717587F 19346
Bangladesh
Groundnuts, with shell
4591044268
M
Barbados
Groundnuts, with shell
23F 25F 25F
Belize
Groundnuts, with shell
989963
Benin
Groundnuts, with shell
114460115562
M
Bolivia (Plurinational State of)
Groundnuts, with shell
139001376914084
Botswana
Groundnuts, with shell
600F 600F
M
Brazil
Groundnuts, with shell
263440312802292781
Bulgaria
Groundnuts, with shell
7000* 7000*
M
Burkina Faso
Groundnuts, with shell
244922300000*
M
Burundi
Groundnuts, with shell
9500F 9500F
M
Cambodia
Groundnuts, with shell
3000025470
M
Cameroon
Groundnuts, with shell
160000* 160000* 160000F
Cape Verde
Groundnuts, with shell

M
M
M
Central African Republic
Groundnuts, with shell
156374159501162691
Chad
Groundnuts, with shell
222276403210
M
China
Groundnuts, with shell
130793631434107513341075*
Colombia
Groundnuts, with shell
258626343852
Comoros
Groundnuts, with shell
900F 900F 900F
Congo
Groundnuts, with shell
23000F 23000F
M
Costa Rica
Groundnuts, with shell
225F 225F
M
Côte d'Ivoire
Groundnuts, with shell
6925649885
M
Cuba
Groundnuts, with shell
10000F 10000F
M
Cyprus
Groundnuts, with shell
910269272
Democratic Republic of the Congo
Groundnuts, with shell
369370370000
M
Dominican Republic
Groundnuts, with shell
31472392
M
Ecuador
Groundnuts, with shell
17000F 17000F
M
Egypt
Groundnuts, with shell
217580208835
M
Eritrea
Groundnuts, with shell
63276327F
M
Ethiopia
Groundnuts, with shell
5108044685
M
Fiji
Groundnuts, with shell
300F 300F
M
Gabon
Groundnuts, with shell
18000F 18000F 18000F
Gambia
Groundnuts, with shell
72557109641121950
Georgia
Groundnuts, with shell
2323F
M
Ghana
Groundnuts, with shell
301770470100485100
Greece
Groundnuts, with shell
15161500F 1500F
Guatemala
Groundnuts, with shell
1700F 1700F
M
Guinea
Groundnuts, with shell
304805315107
M
Guinea-Bissau
Groundnuts, with shell
2470929651
M
Guyana
Groundnuts, with shell
1900F 1900F
M
Haiti
Groundnuts, with shell
2700026000
M
Honduras
Groundnuts, with shell
80F 80F
M
Hungary
Groundnuts, with shell
31015
India
Groundnuts, with shell
918250071680005525000
Indonesia
Groundnuts, with shell
1384400773797777888
Iran (Islamic Republic of)
Groundnuts, with shell
3600F 3600F
M
Iraq
Groundnuts, with shell
2000F 2000F
M
Israel
Groundnuts, with shell
256461673716123
Italy
Groundnuts, with shell

M
M
M
Jamaica
Groundnuts, with shell
37282825
M
Japan
Groundnuts, with shell
188001940020300
Jordan
Groundnuts, with shell
0F 0F
M
Kazakhstan
Groundnuts, with shell
82179300*
Kenya
Groundnuts, with shell
21000F 21000F
M
Kyrgyzstan
Groundnuts, with shell
306283427
Lao People's Democratic Republic
Groundnuts, with shell
3507032690
M
Lebanon
Groundnuts, with shell
7000F 7000F
M
Liberia
Groundnuts, with shell
5300F 5400F
M
Libyan Arab Jamahiriya
Groundnuts, with shell
23000* 23000* 23000F
Madagascar
Groundnuts, with shell
42000F 42000F
M
Malawi
Groundnuts, with shell
261810243215
M
Malaysia
Groundnuts, with shell
823706780
Mali
Groundnuts, with shell
324187325000F 334698
Mauritania
Groundnuts, with shell
800* 800* 800F
Mauritius
Groundnuts, with shell
290320587
Mexico
Groundnuts, with shell
8280980735
M
Morocco
Groundnuts, with shell
496104101030000*
Mozambique
Groundnuts, with shell
10293294454
M
Myanmar
Groundnuts, with shell
1000000* 1000000F
M
Namibia
Groundnuts, with shell
350F 300F
M
Nicaragua
Groundnuts, with shell
156750* 139266
M
Niger
Groundnuts, with shell
147676307776*
M
Nigeria
Groundnuts, with shell
3835600F 3900000F
M
Occupied Palestinian Territory
Groundnuts, with shell
20F 20F
M
Pakistan
Groundnuts, with shell
8340085500
M
Papua New Guinea
Groundnuts, with shell
1200F 1200F
M
Paraguay
Groundnuts, with shell
360002998822590
Peru
Groundnuts, with shell
671565418926
Philippines
Groundnuts, with shell
312053024730978
Portugal
Groundnuts, with shell
30F 30F
M
Republic of Korea
Groundnuts, with shell
69607459
M
Réunion
Groundnuts, with shell
600F 600F
M
Rwanda
Groundnuts, with shell
10000F 11472
M
Saint Kitts and Nevis
Groundnuts, with shell
60F 42
M
Saint Vincent and the Grenadines
Groundnuts, with shell
330F 330F
M
Saudi Arabia
Groundnuts, with shell
4000F 4000F
M
Senegal
Groundnuts, with shell
3311957312101032651
Sierra Leone
Groundnuts, with shell
115000F 115000F
M
Somalia
Groundnuts, with shell
5500F 5500F
M
South Africa
Groundnuts, with shell
580008880099500
Spain
Groundnuts, with shell
75F 75F
M
Sri Lanka
Groundnuts, with shell
98401025013070
Sudan
Groundnuts, with shell
564000716000942000
Suriname
Groundnuts, with shell
6417
M
Swaziland
Groundnuts, with shell
4100F 4100F
M
Syrian Arab Republic
Groundnuts, with shell
223801877014574
Tajikistan
Groundnuts, with shell
153913421300F
Thailand
Groundnuts, with shell
114000* 114000F
M
Timor-Leste
Groundnuts, with shell
4000F 4000F
M
Togo
Groundnuts, with shell
3595041428
M
Tonga
Groundnuts, with shell
850F 850F
M
Turkey
Groundnuts, with shell
864098527490081
Uganda
Groundnuts, with shell
165000173000185000
United Republic of Tanzania
Groundnuts, with shell
300000F 300000F
M
United States of America
Groundnuts, with shell
169672823416301673010
Uruguay
Groundnuts, with shell
1200F 1200F
M
Uzbekistan
Groundnuts, with shell
7000* 7000*
M
Vanuatu
Groundnuts, with shell
2550F 2550F
M
Venezuela (Bolivarian Republic of)
Groundnuts, with shell
10941326
M
Viet Nam
Groundnuts, with shell
510000533800
M
Zambia
Groundnuts, with shell
60000* 70527* 120564*
Zimbabwe
Groundnuts, with shell
12500078600*
M
World + (Total)
Groundnuts, with shell
37681274A 38216299A 35520257A

Sources: FAO.org , CIA.gov , USDA.gov , alibaba.com  and many, many others